
Changelog
Request statistics on the dashboard home
The dashboard home shows your success rate, failed requests and PDF sizes for the last 30 days, and lists your most recent failed requests with their error.
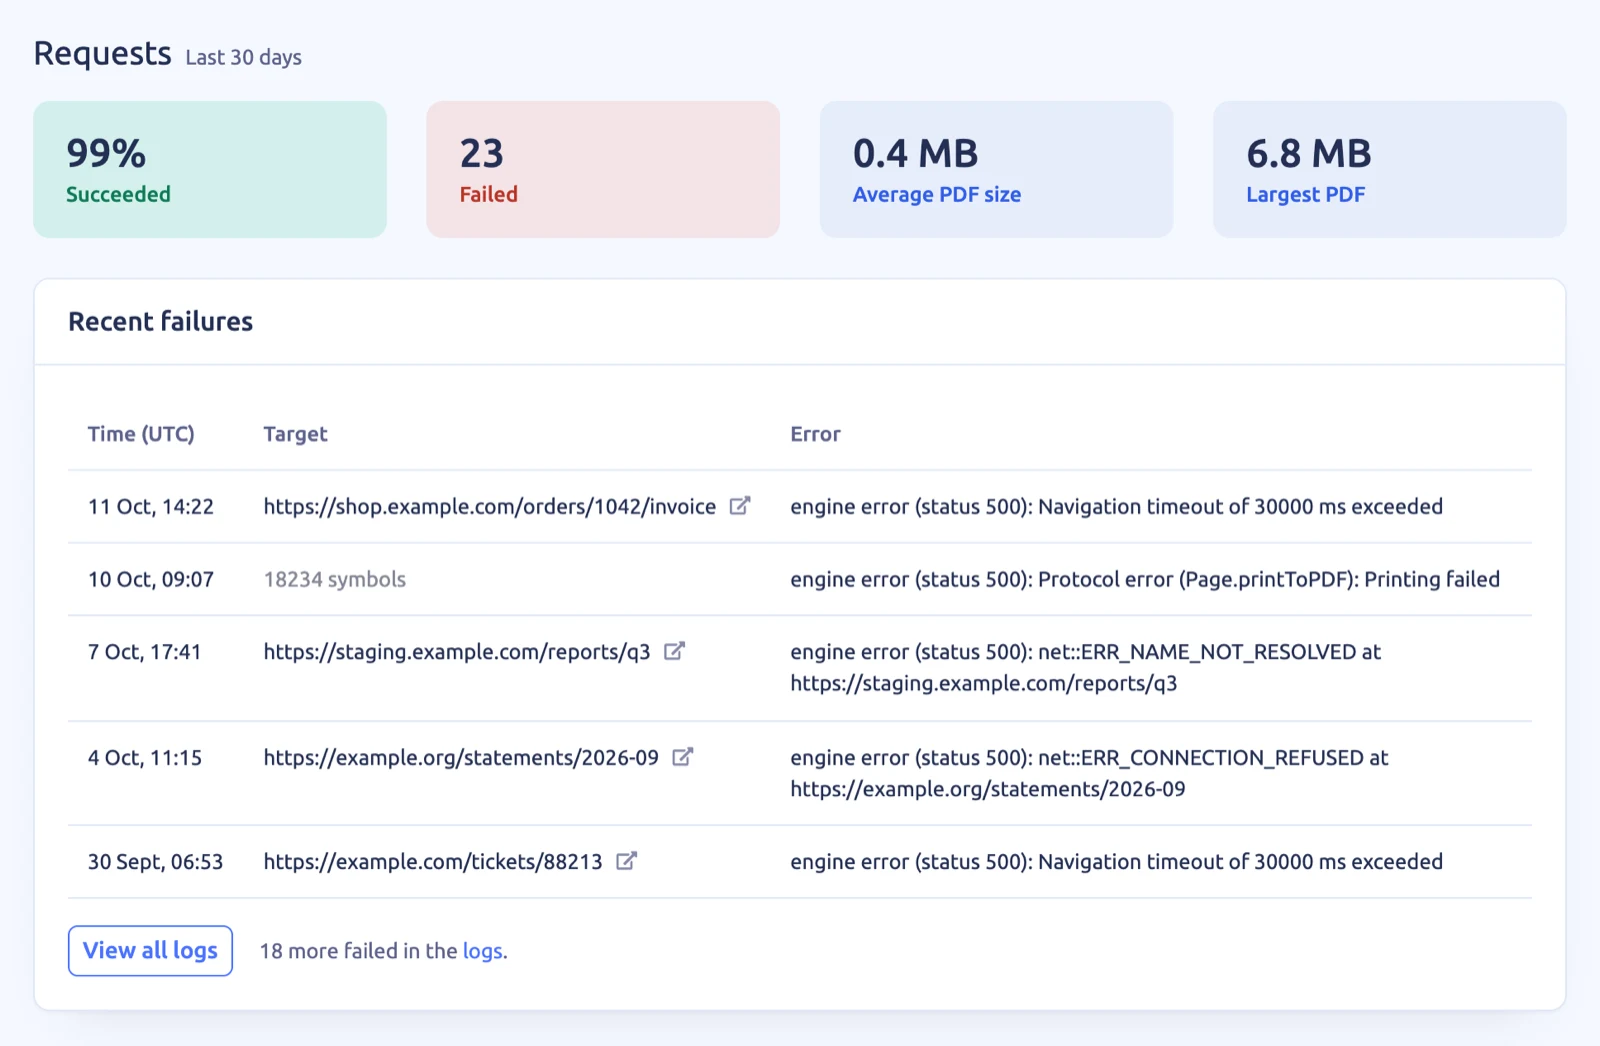
Under Requests, the dashboard home sums up your last 30 days:
- Succeeded — the share of your finished requests that succeeded. It never rounds up to 100% while a request has failed.
- Failed — how many requests failed.
- Average PDF size and Largest PDF — the average and largest size of the PDFs you generated.
Recent failures lists your 5 latest failed requests with the time in UTC, the target and the error message. View all logs opens the Request logs page, and when more requests failed, a link opens the failed ones there.
This replaces the list of your 10 most recent requests. Every request is still on the Request logs page, which now has filters, date ranges and live mode.