
Changelog
Request logs with filters, date ranges and live mode
The Logs page is now Request logs. Filter your requests by status and period, load requests older than the latest 100, and switch on Live to watch new ones arrive.
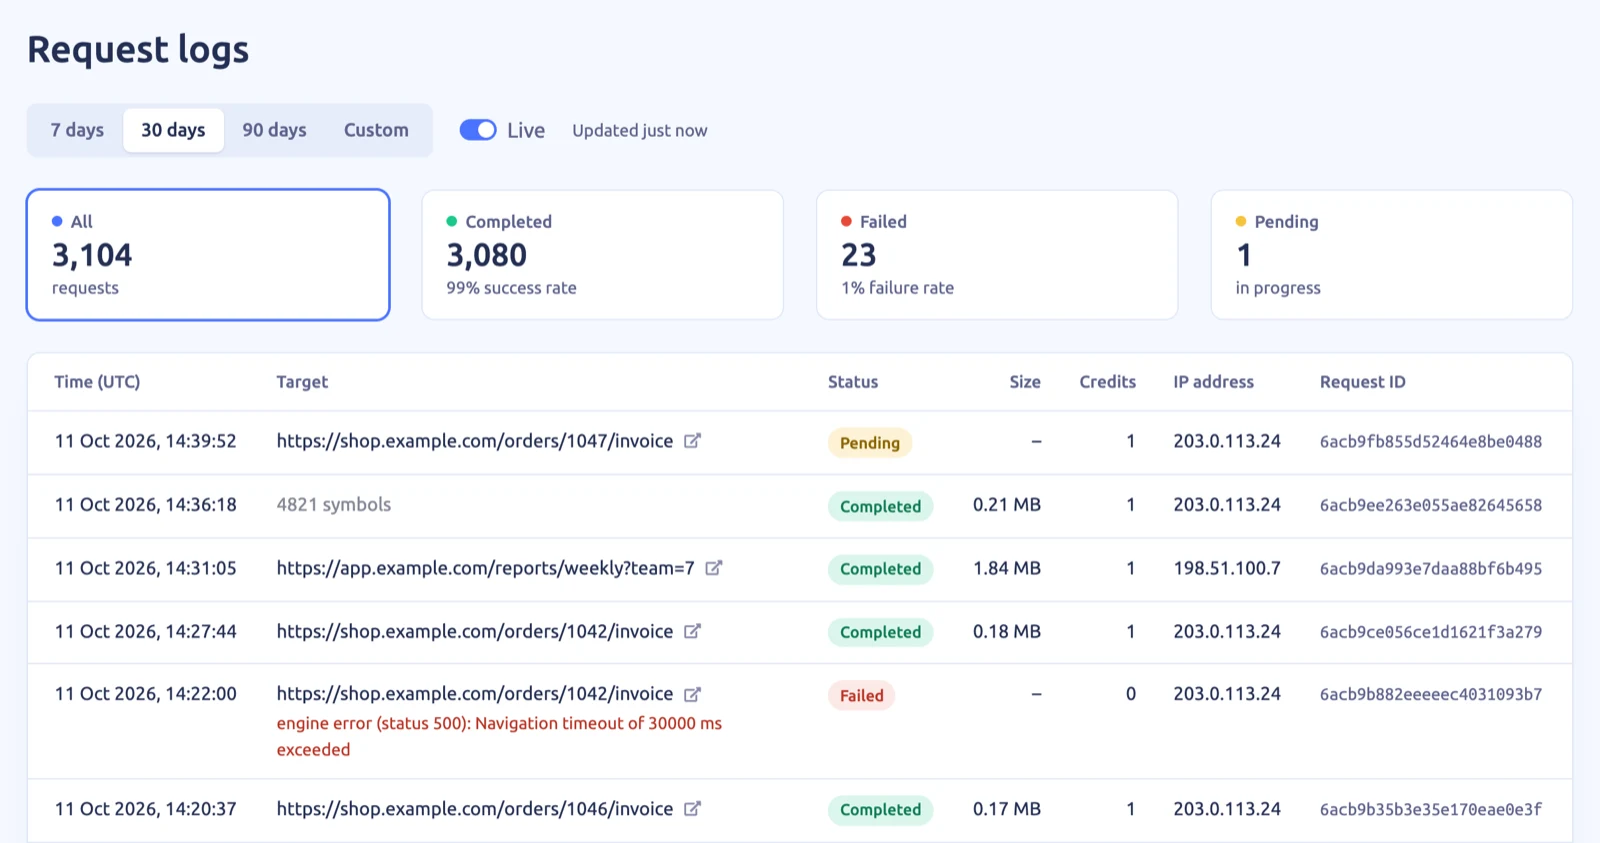
The Logs page used to list your latest 100 requests and nothing more. It is now called Request logs, and you can look further back and narrow down what you see:
- Period — the last 7, 30 or 90 days, or Custom with your own From and To dates. Dates and times are in UTC.
- Status — the totals for the period are shown for all requests and for completed, failed and pending ones, with the success and failure rate. Select a total to list only those requests.
- Older requests — the table loads 100 requests at a time, and Load more adds the next 100, up to 2,000. To go further back, narrow the period.
- Errors — a failed request shows its error message under the target.
- Live — switch on Live and the table refreshes every 5 seconds with the newest 100 requests, so you can watch an integration while you test it.
Each row shows the time, target, status, PDF size, credits used, IP address and request ID. A target URL is plain text that is easy to copy, with an icon beside it to open it in a new tab.
The period, status and Live setting are kept in the page address, so you can bookmark a view, such as the failed requests of the last 7 days.